


18-10-2013, 02:02 AM
Hi,
I am trying to represent California's Zero Emission Vehicle (ZEV) mandate in a user constraint but I'm running into trouble.
I thought the representation is relatively straightforward but I'm having trouble setting it up as a VEDA scenario file.
Each ZEV vehicle type has a weighting factor (a) that is multiplied by the number of vehicles sold in a given year to give more or less "credit" to that vehicle. Full battery electric vehicles and fuel cells have greater weights than a plug in hybrid (which isn't a true ZEV).
The sum of these weighted ZEV sales has to be greater than or equal to a given percentage of total car sales.
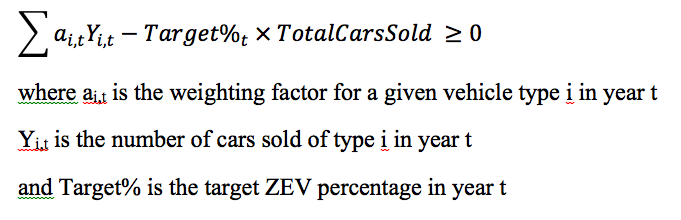
The challenge I'm having is that I'm entering the weighting coefficients (a) for each individual ZEV vehicles as UC_NCAP values but I am also trying to sum across all vehicle sold (not just ZEVs), which has another coefficient (the ZEV Target %).
Below is what I put together:
The first set of rows with "TCAR*" is meant to represent the 2nd half of the left side of the equation, the UC_NCAP values are the ZEV target percentages for each year.
All the subsequent rows are meant to just give the weighting factors for each type of vehicle.
but I know it's not quite right because when I view the UC Master, I can see that I have not differentiated between the TCAR* values (i.e. all the vehicles I'm trying to sum across) and the individual vehicle vehicle types (e.g. TCARELC1, TCARELC2, TCARFCH2, etc) and the coefficients that I'm specifying for the weighting factors is being written in the same spot as the Target percentage.
Hopefully this question is somewhat clear. Thanks in advance for any help that you can provide.
Chris
I am trying to represent California's Zero Emission Vehicle (ZEV) mandate in a user constraint but I'm running into trouble.
I thought the representation is relatively straightforward but I'm having trouble setting it up as a VEDA scenario file.
Each ZEV vehicle type has a weighting factor (a) that is multiplied by the number of vehicles sold in a given year to give more or less "credit" to that vehicle. Full battery electric vehicles and fuel cells have greater weights than a plug in hybrid (which isn't a true ZEV).
The sum of these weighted ZEV sales has to be greater than or equal to a given percentage of total car sales.
The challenge I'm having is that I'm entering the weighting coefficients (a) for each individual ZEV vehicles as UC_NCAP values but I am also trying to sum across all vehicle sold (not just ZEVs), which has another coefficient (the ZEV Target %).
Below is what I put together:
The first set of rows with "TCAR*" is meant to represent the 2nd half of the left side of the equation, the UC_NCAP values are the ZEV target percentages for each year.
All the subsequent rows are meant to just give the weighting factors for each type of vehicle.
but I know it's not quite right because when I view the UC Master, I can see that I have not differentiated between the TCAR* values (i.e. all the vehicles I'm trying to sum across) and the individual vehicle vehicle types (e.g. TCARELC1, TCARELC2, TCARFCH2, etc) and the coefficients that I'm specifying for the weighting factors is being written in the same spot as the Target percentage.
Hopefully this question is somewhat clear. Thanks in advance for any help that you can provide.
Chris
| ~UC_Sets: R_E: AllRegions | |||||||||||||
| ~UC_Sets: T_E: | |||||||||||||
| ~UC_T | |||||||||||||
| UC_N | UC_ATTR~LHS | Pset_Set | Pset_PN | Pset_CO | Cset_SET | Cset_CN | Attribute | Year | LimType | UC_NCAP | UC_RHSRTS | UC_RHSRTS~0 | UC_Desc |
| \I: ZEV Mandate Overall Constraint | |||||||||||||
| UC_ZEV_TZEV_to_2025 | NCAP | TCAR* | 2012 | LO | -0.03 | 0 | 15 | ||||||
| TCAR* | 2013 | -0.03 | |||||||||||
| TCAR* | 2014 | -0.03 | |||||||||||
| TCAR* | 2015 | -0.06 | |||||||||||
| TCAR* | 2016 | -0.06 | |||||||||||
| TCAR* | 2017 | -0.06 | |||||||||||
| TCAR* | 2018 | -0.05 | |||||||||||
| TCAR* | 2019 | -0.07 | |||||||||||
| TCAR* | 2020 | -0.1 | |||||||||||
| TCAR* | 2021 | -0.12 | |||||||||||
| TCAR* | 2022 | -0.15 | |||||||||||
| TCAR* | 2023 | -0.17 | |||||||||||
| TCAR* | 2024 | -0.2 | |||||||||||
| TCAR* | 2025 | -0.22 | |||||||||||
| TCARELC1 | 2012 | 3 | |||||||||||
| TCARELC1 | 2017 | 3 | |||||||||||
| TCARELC1 | 2018 | 1.5 | |||||||||||
| TCARELC1 | 2025 | 1.5 | |||||||||||
| TCARELC2 | 2012 | 4 | |||||||||||
| TCARELC2 | 2017 | 4 | |||||||||||
| TCARELC2 | 2018 | 2.5 | |||||||||||
| TCARELC2 | 2025 | 2.5 | |||||||||||
| TCARFCH2 | 2012 | 9 | |||||||||||
| TCARFCH2 | 2017 | 9 | |||||||||||
| TCARFCH2 | 2018 | 4 | |||||||||||
| TCARFCH2 | 2025 | 4 | |||||||||||
| TCAR*PHEV10 | 2012 | 1.1 | |||||||||||
| TCAR*PHEV10 | 2017 | 1.1 | |||||||||||
| TCAR*PHEV10 | 2018 | 0.4 | |||||||||||
| TCAR*PHEV10 | 2025 | 0.4 | |||||||||||
| TCAR*PHEV30 | 2012 | 2.0 | |||||||||||
| TCAR*PHEV30 | 2017 | 2.0 | |||||||||||
| TCAR*PHEV30 | 2018 | 0.6 | |||||||||||
| TCAR*PHEV30 | 2025 | 0.6 | |||||||||||
| TCAR*PHEV40 | 2012 | 2.5 | |||||||||||
| TCAR*PHEV40 | 2017 | 2.5 | |||||||||||
| TCAR*PHEV40 | 2018 | 0.7 | |||||||||||
| TCAR*PHEV40 | 2025 | 0.7 | |||||||||||
| TCAR*PHEV60 | 2012 | 3.0 | |||||||||||
| TCAR*PHEV60 | 2017 | 3.0 | |||||||||||
| TCAR*PHEV60 | 2018 | 0.9 | |||||||||||
| TCAR*PHEV60 | 2025 | 0.9 |


